SyncPro is a visualization package targeting on processed mass spectrometry data. It uses synchronization and layering techiques in graphics to simultaneously visualize groups of MS datasets.
The major features of SyncPro are :
- synchronizing different datasets and different kinds of plots in visualization
- facilitating data exploration through selection and extraction
- providing a quick judgment tool for the quality of selected features
Recommended hardware configurations
- Central Processing Unit : 2GHz or above
- Memory : 2GB or above
Required system configurations
Version 1.04 -- 20/08/2010
- Implement Level of Detail for 2D intensity plot to impore rendering speed.
- Rewrite synchronization related class to improve synchronization speed and simplify extension steps of implementing new synchronization features.
- Support loading configurations from file.
Version 1.03 -- 20/01/2010
- Feature statistic tool window tab is avaliable for evaluating features with statistic scores.
Version 1.02 -- 25/11/ 2009
- Support MZML(version 1.1.0) file format.
- Minor bug fixs in ProjectManagenment and FileChooser.
- Panning mode is avaliable for 2D-intensity plot.
Version 1.01 -- 17/ 08 / 2009
- Undo/Redo functions for selections in intensity plots and features in feature window tool tab are avaliable now.
- Minor bug fixs in selections of Intensity plots.
- Minor bug fixs in check loops of types of files supported.
Version 1.00 -- 07 / 08 / 2009
- First release of demo version of SyncPro
SyncPro (version 1.04) is avaliable for free.
Java executable : HERE, Source code : HERE.
Sample datasets and a sample project can be found HERE.
A quick start manual for SyncPro can be found HERE.
All related files and older version of SyncPro can be found in the mirror site of SyncPro in SourceForge : HERE.
|
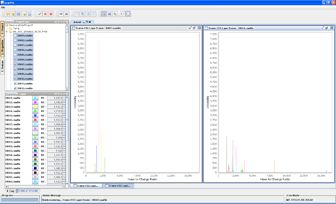
Synchronization
|
|
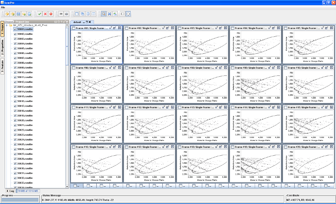
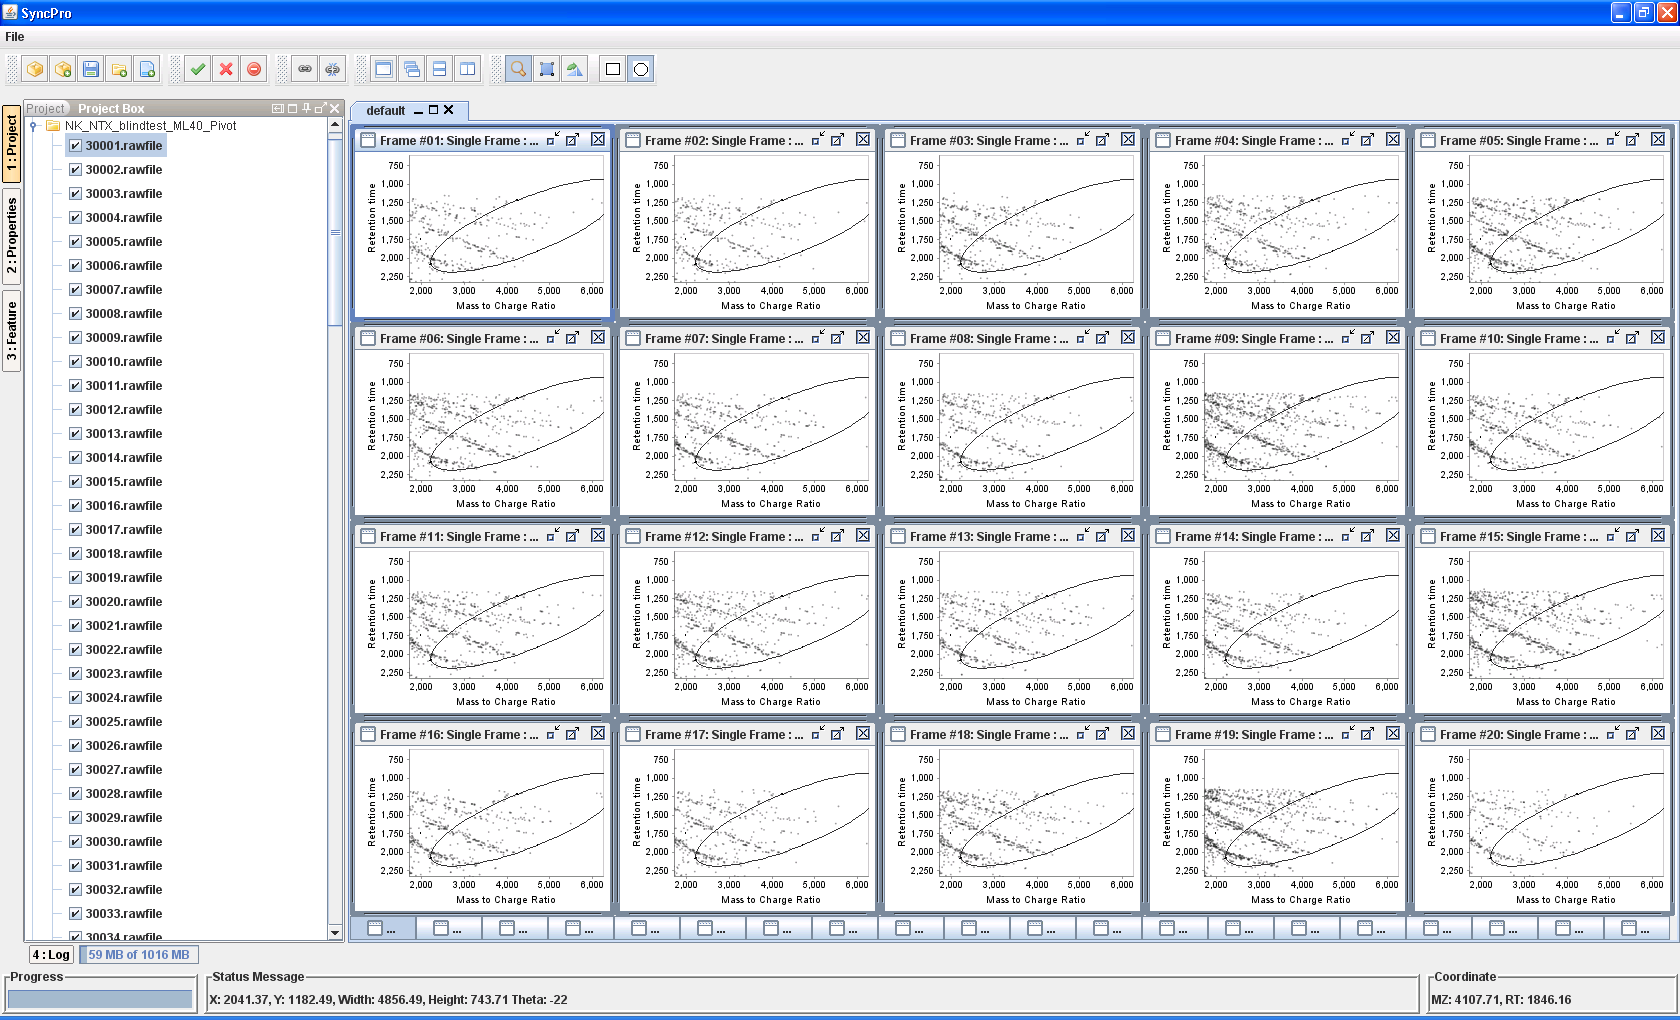
click the graph to enlarge
Fig. 1 2D-intensity plots for 20 unknown samples
|
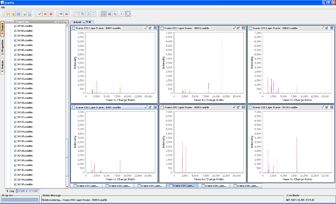
click the graph to enlarge
Fig. 2 Spectrum plots of 120 unknown samples (each spectrum plot shows 20 samples)
|
|
Layering
|
|
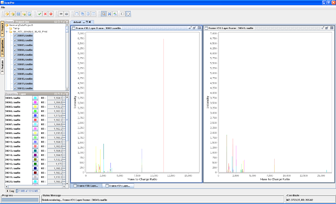
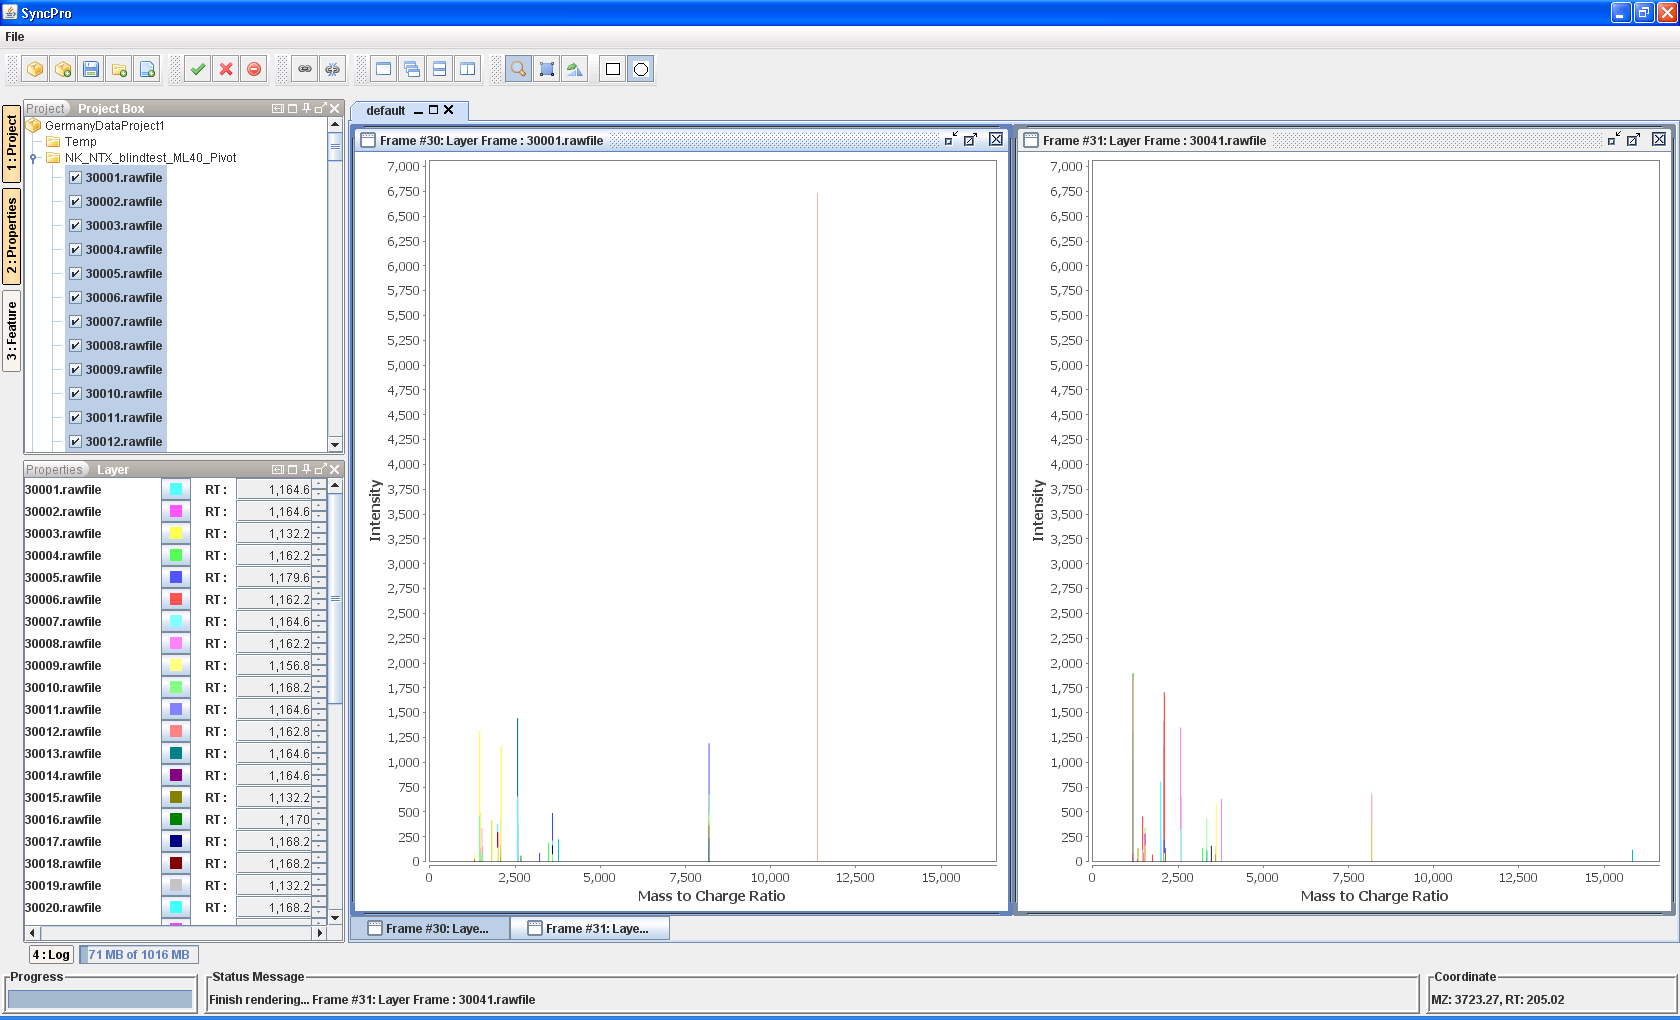
click the graph to enlarge
Fig. 3 Spectrum plots of 80 unknown samples (each spectrum contains 40 samples, 10 of 40 samples in the spectra are the same)
|
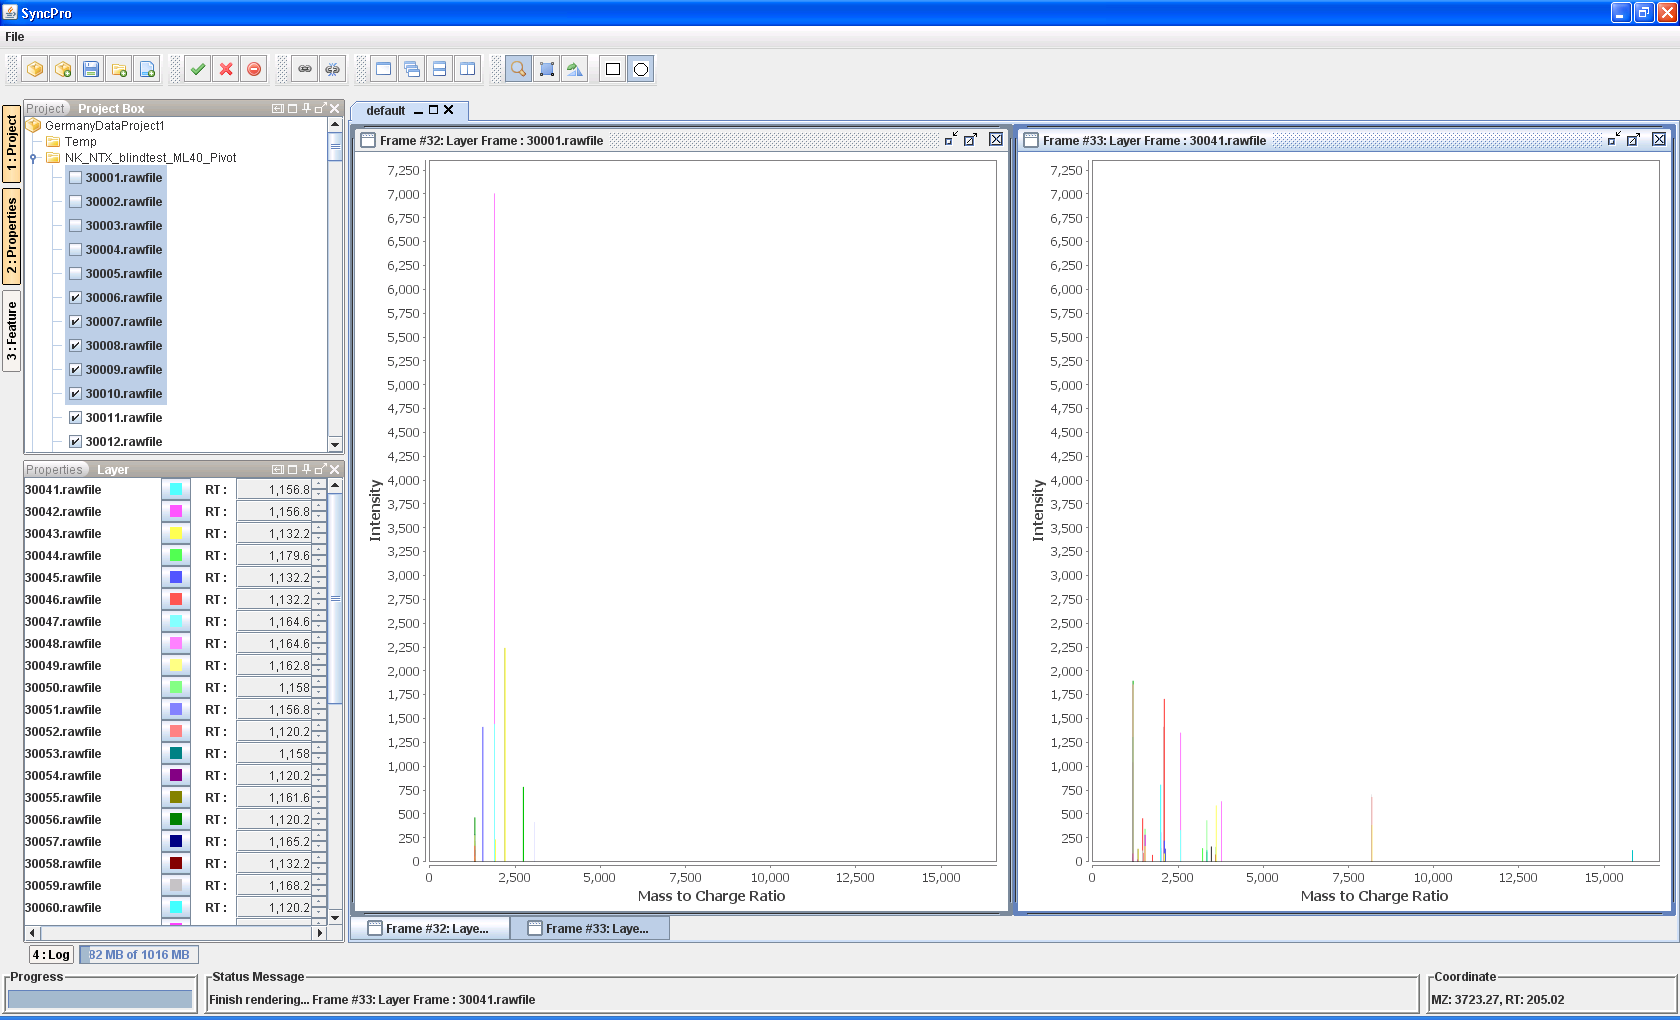
click the graph to enlarge
Fig. 4 Spectrum plots of 80 unknown samples (each spectrum contains 40 samples, 5 of 40 samples in the spectra are set to be invisible)
|
|
Miscellaneous Plots
|
|
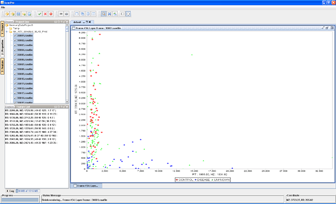
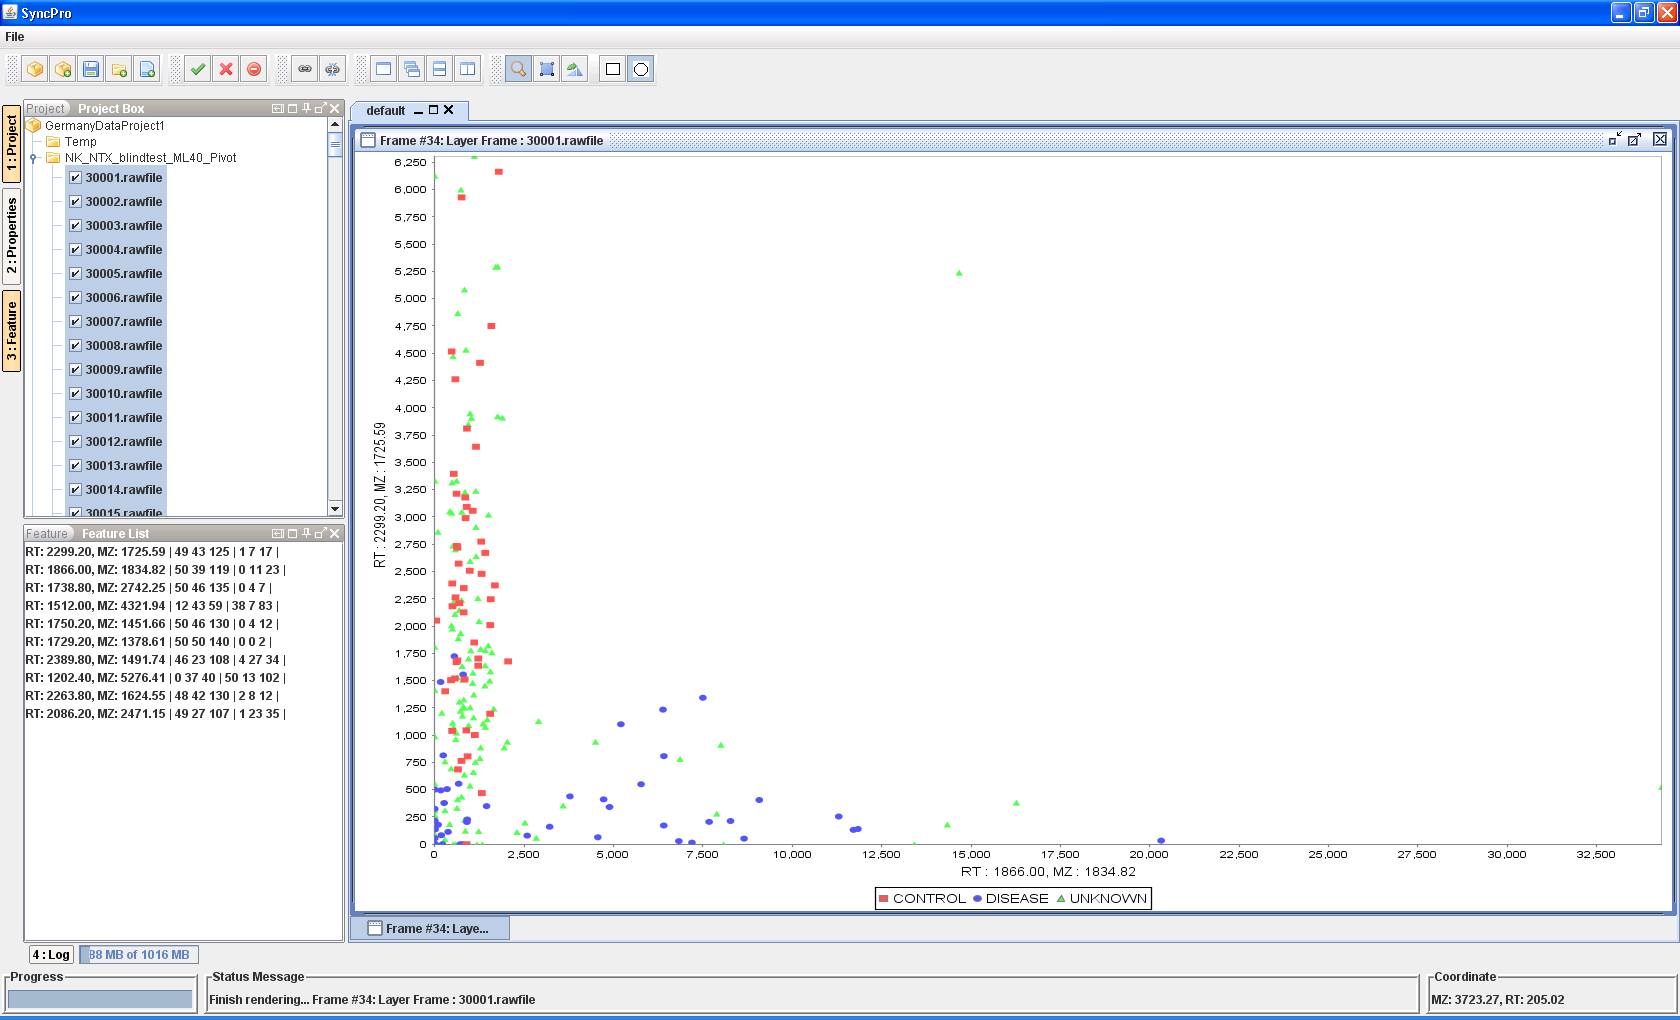
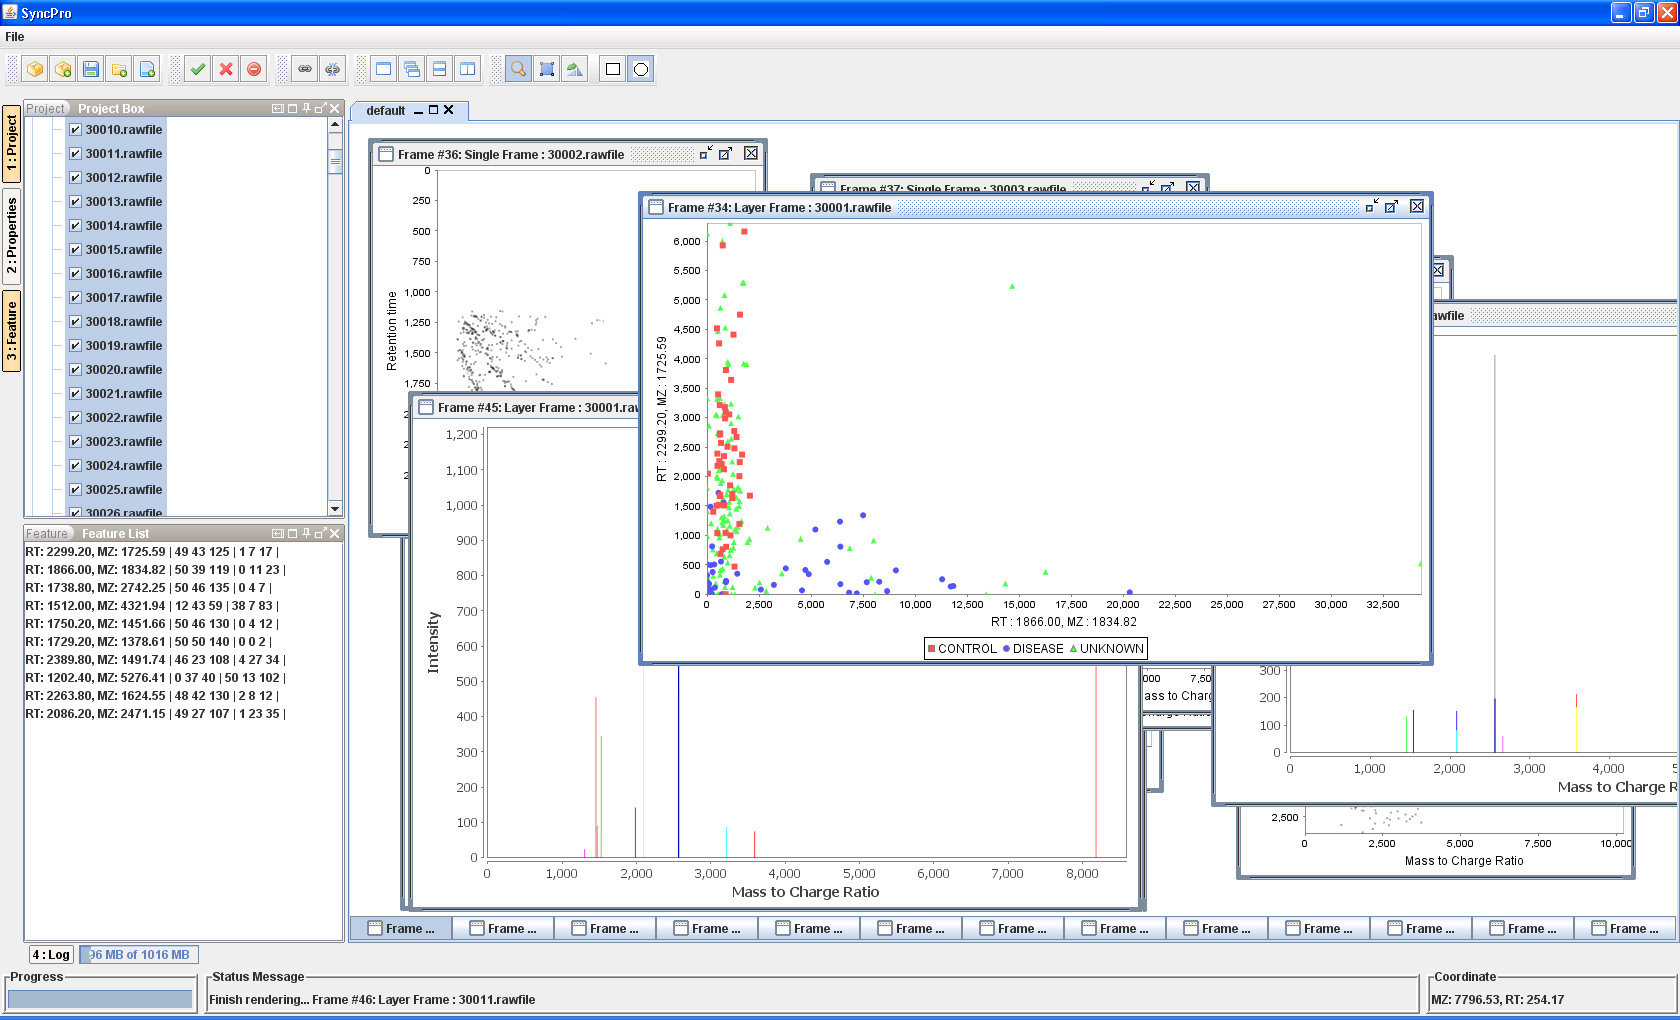
click the graph to enlarge
Fig. 5 Screenshot for a feature scatter plot
|
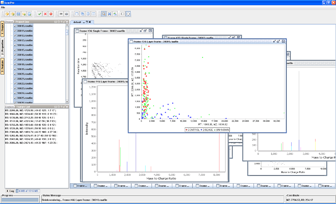
click the graph to enlarge
Fig. 6 Screenshot for showing various visualization types of SyncPro
|
Core software packages used :
Miscellaneous source codes and resources used :